Current-Voltage relationships
In this experiment the resistance of a lamp, resistor or diode is measured as the
current is varied. Voltage and current sensors make the measurements while the software
plots the results in real-time. After the experiment, the resistance and the power can be
plotted against the potential difference.
What you need

Rheostat, dry-cells, lamp, Si / Ge diodes, resistors (for example 18 and 36 ohm),
interface, voltage and current sensors.
Setting up
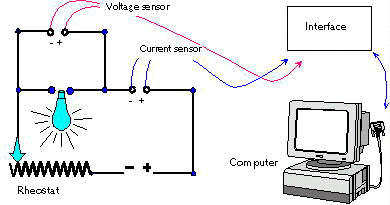
Connect up the circuit as shown.
Connect the current sensor to the first socket on the interface and the voltage sensor to
the second socket. If the sensors are adjustable, set a 1A range on the current sensor and
a 2V range on the voltage sensor.
Run your sensing software. You may need to do a short test run to establish a suitable
voltage for the power supply. Your system may recognise the sensors automatically,
otherwise you will need to set them up yourself.
Note that you will not be recording against time as you usually do, just one variable
against another. Get the software to plot the current against potential difference, as the
experiment proceeds.
Start recording. Move the rheostat slider to change the current in small steps. See that
the software plots readings as you do this. If you cannot see any points, your readings
may simply be out of range.
You might then plot: the resistance (V / I) against potential difference or the power (V x
I) against potential difference.
Questions
What does the graph tell you about the change in current?
What does the graph tell you about the change in potential difference?
What is the relationship between current and potential difference?
Use the software to calculate the resistance (V / I). Plot this resistance against the
potential difference.
Use the software to calculate power (V x I). Plot this against potential difference.
Teacher question
Your software can plot the current and potential difference against time. Is this
better than the approach suggested above? Click here to
respond.

This activity was adapted by Roger Frost
from The IT
in Science book of Data logging and Control. This page is � IT in Science. It may be
reproduced only for use within your school.

Back to top